
Description
Book Details
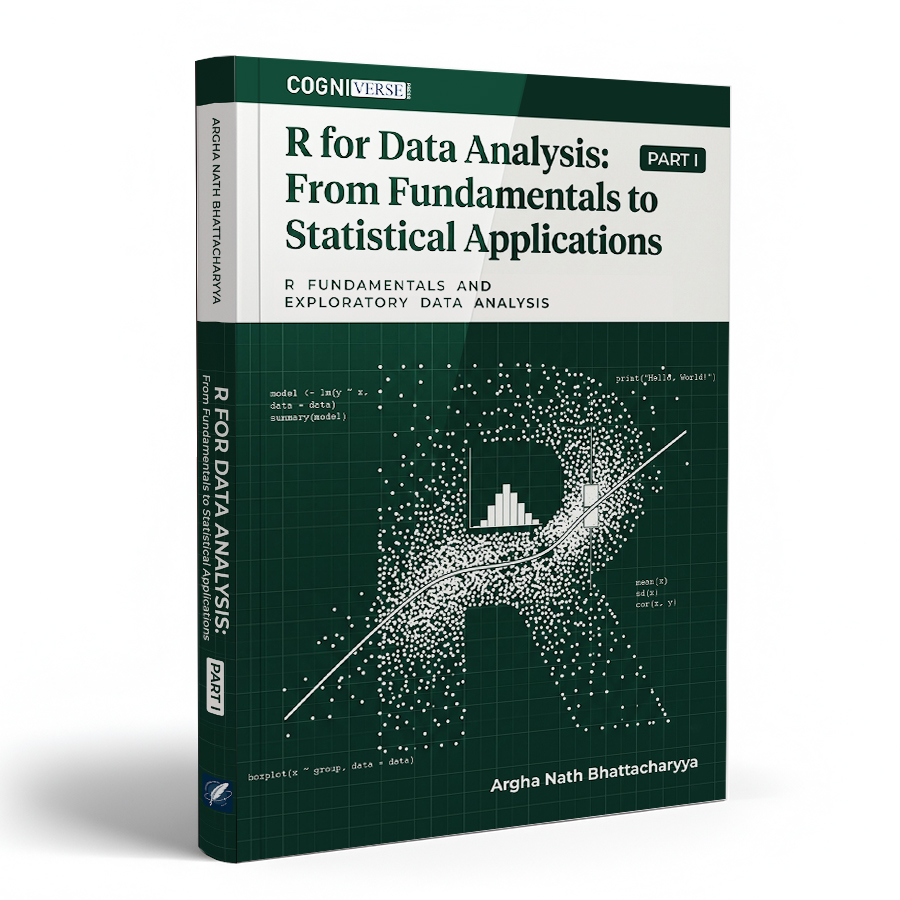
Title: R for Data Analysis: From Fundamentals to Statistical Applications, (Part I: R Fundamentals and Exploratory Data Analysis)
Author: Argha Nath Bhattacharyya
Publisher: Cogniverse Press
Edition: First Edition
Publication Date: September, 2026
ISBN: 978-81-68073-45-6
e-ISBN: 978-81-68073-46-3
DOI: 10.5281/zenodo.23052589
Preface
The growing availability of data across almost every field of study has made data analysis an essential component of contemporary education, research, and professional practice. Whether in Statistics, science and technology, health sciences, nutrition, psychology, economics, management, social sciences, or other applied disciplines, the ability to understand, analyse, and interpret data has become increasingly important. Alongside statistical knowledge, familiarity with appropriate computational tools is now an integral part of modern data analysis.
R has emerged as one of the most widely used environments for statistical computing, data analysis, and graphical representation. Its extensive statistical capabilities, flexibility, powerful visualization facilities, and large collection of packages make it a valuable tool for students, researchers, educators, and professionals. However, for a beginner, learning R can initially appear challenging, particularly when programming concepts and statistical terminology are encountered simultaneously.
This book, R for Data Analysis, has been written primarily with this challenge in mind. The principal objective is to provide a clear and systematic introduction to R and its application in data analysis, particularly for students who do not have a strong background in Statistics. The book is designed to introduce the fundamental concepts gradually, allowing readers to develop familiarity with R while simultaneously understanding the basic ideas necessary for working with data.
At the same time, the book is not intended exclusively for students from non-statistical disciplines. Students of Statistics who possess theoretical knowledge but are beginning to use R for practical data analysis can also benefit from the approach adopted here. Statistical theory and computational implementation are closely connected in contemporary statistical practice, and the ability to translate statistical concepts into appropriate R commands is an important component of statistical competence.
The central philosophy of this book is that learning R should go hand in hand with understanding data. The purpose of statistical software is not merely to produce numerical output, but to assist the analyst in exploring data, identifying patterns, applying appropriate statistical procedures, and interpreting the results meaningfully. Therefore, readers are encouraged to understand not only which R command is used, but also why it is used and what the resulting output represents.
The book begins with the foundational aspects of R that are necessary for subsequent statistical analysis. Basic programming concepts, data structures, functions, packages, data handling, and graphical representations are introduced progressively. These concepts are presented from the perspective of their usefulness in data analysis, so that beginners can gradually develop both computational confidence and analytical understanding.
An important feature of the intended approach is its applicability to learners from different academic backgrounds. Students in interdisciplinary programmes often need to analyse quantitative data without having undergone extensive formal training in Statistics or programming. For such learners, the initial difficulty is frequently not the statistical procedure itself, but understanding how a practical data-analysis problem can be represented and solved computationally. This book seeks to provide that bridge between the problem, the statistical concept, the R code, and the interpretation of the result.
The book also emphasizes that statistical computing and statistical judgment are not synonymous. R can perform calculations efficiently, but the selection of an appropriate statistical method remains an analytical responsibility. A meaningful analysis requires consideration of the research question, nature and structure of the data, assumptions associated with the method, and appropriate interpretation of the results. Thus, the objective is to develop not merely familiarity with R commands, but a systematic approach to data analysis.
This volume is intended to serve as a foundation for further study. The concepts introduced here provide the necessary groundwork for more advanced statistical computing. The subsequent part of the book will extend the discussion to more advanced statistical concepts and their appropriate implementation in R.
Acknowledgement
With deepest love and gratitude, I wholeheartedly dedicate this book to my dearest Maa and Baba. Your boundless sacrifices, unshakable faith, and unwavering support have been the cornerstone of my life. From the earliest days of my learning, your words, values, and quiet strength have shaped not just my academic journey, but the very person I have become. Maa, your warmth, patience, and prayers have always lit my path. Baba, your integrity, discipline, and wisdom have been my guiding force. This work is not only a product of my effort, but a reflection of the life lessons you’ve instilled in me.
I also extend my heartfelt respect and sincere gratitude to all my teachers, whose unwavering guidance, profound knowledge, and generous mentorship have played a pivotal role throughout my academic journey. Their encouragement and wisdom continue to inspire and shape my scholarly pursuits.
To my Family, your love and encouragement have always been my strength in times of challenge and joy.
And to all my beloved Students, your curiosity, enthusiasm, and thirst for learning constantly motivate me to explore, grow, and share knowledge with renewed passion.
Intended Audience
The book is particularly suitable for:
- Undergraduate and postgraduate students beginning their journey with R.
- Students from non-statistical disciplines who require R for data analysis.
- Statistics students seeking practical computational experience.
- Researchers who wish to develop a foundation in R-based statistical analysis.
- Instructors introducing R within courses involving Statistics, research methodology, biostatistics, or quantitative data analysis.
Table of Contents
1 Getting Started with R
- 1.1 Why We Need Data Analysis?
- 1.2 Introduction to R Programming
- 1.3 Installing R and RStudio
- 1.4 Graphical User Interface (GUI) of R
- 1.5 Writing and Executing R Code
- 1.6 The RStudio Interface
- 1.7 Keyboard Shortcut Keys in R
- 1.8 Changing Font Size and Font Style in R
- 1.9 Generating a PDF from R Console Output Using the Print Option
- 1.10 The Working Directory and Workspace
- 1.11 Comments in R
- 1.12 Data Types in R
- 1.13 Useful Built-in Character Vectors
- 1.14 Inspecting Data Types
- 1.15 Converting Data Types
- 1.16 Automatic Type Coercion in R
- 1.17 Rules for Naming Variables in R
- 1.18 Symbols Used in R
- 1.19 Installing and Using Packages
- 1.20 Getting Help in R
- 1.21 Common Error Messages in R Console
- Chapter Summary
- Exercises
2 Importing and Managing Data
-
2.1 Importing Data from Keyboard and Manual Entry
- 2.1.1 Using Vectors
- 2.1.2 Using Data Frames
- 2.1.3 Using the edit() Function
- 2.2 Importing Data from Text Files
- 2.3 Importing Data from CSV Files
- 2.4 Importing Data from Excel Files
- 2.5 Importing Data from Other Statistical Software
- 2.6 Importing Data from the Web
- 2.7 Importing Data from Google Sheets
- 2.8 Importing Data from Inbuilt Packages
- 2.9 Understanding Data Structures in R
- 2.10 Different Manipulations on Vectors
- 2.11 Operations on Vectors
- 2.12 Recycling Rule and Vectorized Operations in R
- 2.13 Different Manipulations on Matrix and Data Frame
-
2.14 Understanding the Dimensions and Structure of Datasets
- 2.14.1 The str() Function
- 2.14.2 The dim() Function
- 2.14.3 The length() Function
- 2.14.4 The summary() Function
- 2.14.5 The head() Function
- 2.14.6 The tail() Function
- Chapter Summary
- Exercises
3 Some Important Functions In R
- 3.1 The c() Function in R
- 3.2 The : (Colon) Operator in R
- 3.3 The sample() Function in R
- 3.4 The seq() Function in R
- 3.5 The paste() Function in R
-
3.6 Printing Functions in R
- 3.6.1 The print() Function
- 3.6.2 The cat() Function
- 3.6.3 The sprintf() Function
- 3.6.4 The message() Function
- 3.6.5 The warning() Function
- 3.7 The set.seed() Function in R
- 3.8 The table() Function in R
- 3.9 The prop.table() Function in R
- 3.10 The cut() Function in R
- 3.11 The rep() Function in R
-
3.12 The matrix() Function in R
- 3.12.1 Basic Matrix Operations: dim(), t(), rbind(), cbind()
- 3.13 The list() Function in R
- 3.14 The data.frame() Function in R
- 3.15 Inspecting Data: str(), summary(), head(), and tail()
- 3.16 The factor() Function in R
- 3.17 The format() Function in R
- 3.18 Rounding Functions: round(), ceiling(), floor(), trunc()
- 3.19 Locating Values: which(), which.max(), which.min()
- 3.20 Handling Missing Values: is.na(), na.omit(), complete.cases()
- 3.21 Basic String-Handling Functions
- Chapter Summary
- Exercises
4 Control Structures and Functions in R
- 4.1 Introduction to Program Flow in R
- 4.2 Logical Values and Logical Operators
- 4.3 Relational Operators in R
- 4.4 Boolean Expressions and Truth Tables
-
4.5 Conditional Statements
- 4.5.1 The if Statement
- 4.5.2 The if–else Statement
- 4.5.3 Nested if–else Statement
- 4.5.4 ifelse() Function (Vectorized Conditional Statement)
- 4.5.5 Using switch() in R
-
4.6 Iteration in R
- 4.6.1 The for Loop
- 4.6.2 The while Loop
- 4.6.3 The repeat Loop
- 4.6.4 Nested Loops
- 4.6.5 Loop Control: break and next
-
4.7 Vectorized Alternatives to Loops
- 4.7.1 Using apply(), lapply(), sapply()
- 4.7.2 Using tapply() and aggregate()
- 4.7.3 Using mapply() and Map()
- 4.7.4 Advantages of Vectorization
-
4.8 Functions in R
- 4.8.1 Built-in Functions
- 4.8.2 User-Defined Functions
- 4.8.3 Function Arguments and Return Values
- 4.8.4 Default and Named Arguments
- 4.8.5 Anonymous Functions
- 4.8.6 Recursive Functions
- 4.8.7 Scope of Variables in Functions
- 4.8.8 Local and Global Environments
-
4.9 Error Handling in Functions
- 4.9.1 Using stop(), warning(), message()
- 4.9.2 Using try() and tryCatch()
-
4.10 Writing Efficient and Readable Code
- 4.10.1 Code Optimization
- 4.10.2 Avoiding Common Programming Errors
- 4.11 Applications in Statistical Computing
- Chapter Summary
- Exercises
5 Turning Data into Diagrams
- 5.1 Basic Graphical Parameters in R
-
5.2 Bar Diagrams
- 5.2.1 Simple Bar Diagram
- 5.2.2 Multiple Bar Diagram
- 5.2.3 Sub-divided (Component) Bar Diagram
- 5.2.4 Percentage Bar Diagram
- 5.2.5 Deviation Bar Diagram
-
5.3 Pie Chart (Circular Diagram)
- 5.3.1 Simple Pie Chart
- 5.3.2 Exploded Pie Chart
- 5.3.3 3D Pie Chart
-
5.4 Histogram
- 5.4.1 Histogram with Equal Class Intervals
- 5.4.2 Histogram with Unequal Class Intervals
- 5.4.3 Frequency Density Histogram
-
5.5 Frequency Polygon
- 5.5.1 Frequency Polygon with Histogram
- 5.5.2 Frequency Polygon without Histogram
- 5.6 Frequency Curve
-
5.7 Ogive (Cumulative Frequency Curve)
- 5.7.1 Less Than Ogive
- 5.7.2 More Than Ogive
- 5.7.3 Locating the Median Graphically
-
5.8 Line Graph (Time Series Graph)
- 5.8.1 Simple Line Graph
- 5.8.2 Multiple Line Graph
- 5.8.3 Area Graph
- 5.9 Scatter Plot (Scatter Diagram)
- 5.10 Box Plot (Box-and-Whisker Plot)
- 5.11 Stem-and-Leaf Plot
- 5.12 Dot Plot
- 5.13 Pictograph
- 5.14 Bubble Chart
- 5.15 Pareto Chart
- 5.16 Lorenz Curve
- 5.17 Density Plot
- 5.18 Violin Plot
- 5.19 Heat Map
- 5.20 Radar Chart (Spider Diagram)
- 5.21 Tree Map
- Chapter Summary
- Exercises
6 Descriptive Statistics
-
6.1 Central Tendency
- 6.1.1 Arithmetic Mean
- 6.1.2 Median
- 6.1.3 Mode
- 6.1.4 Geometric Mean
- 6.1.5 Harmonic Mean
- 6.1.6 Trimmed Mean
- 6.1.7 Winsorised Mean
- 6.1.8 Weighted Mean
- 6.1.9 Percentile
- 6.1.10 Quartiles
-
6.2 Dispersion
- 6.2.1 Range
- 6.2.2 Interquartile Range (IQR)
- 6.2.3 Quartile Deviation (Semi-Interquartile Range)
- 6.2.4 Mean Deviation
- 6.2.5 Variance
- 6.2.6 Standard Deviation
- 6.2.7 Coefficient of Variation (CV)
- 6.2.8 Extreme Values and Outlier Detection
- 6.3 Skewness
- 6.4 Kurtosis
- Chapter Summary
- Exercises
7 Correlation Analysis for Continuous and Ordinal Data
- 7.1 Correlation
- 7.2 Scatter Plot
- 7.3 Pearson Correlation Coefficient
- 7.4 Spearman’s Rank Correlation Coefficient (ρs)
- 7.5 Ties in Spearman’s Correlation
- 7.6 Kendall’s Tau-a Rank Correlation Coefficient
- 7.7 Kendall’s Tau-b Rank Correlation Coefficient
- 7.8 Kendall’s Tau-c Rank Correlation Coefficient
- 7.9 Polychoric Correlation
- 7.10 Polyserial Correlation
- Chapter Summary
- Exercises
8 Correlation Analysis for Categorical and Binary Data
- 8.1 Point–Biserial Correlation
- 8.2 Biserial Correlation
- 8.3 Phi Coefficient
- 8.4 Tetrachoric Correlation
- 8.5 Cramer’s V
- Chapter Summary
- Exercises



Reviews
There are no reviews yet.