
Description
Book Details
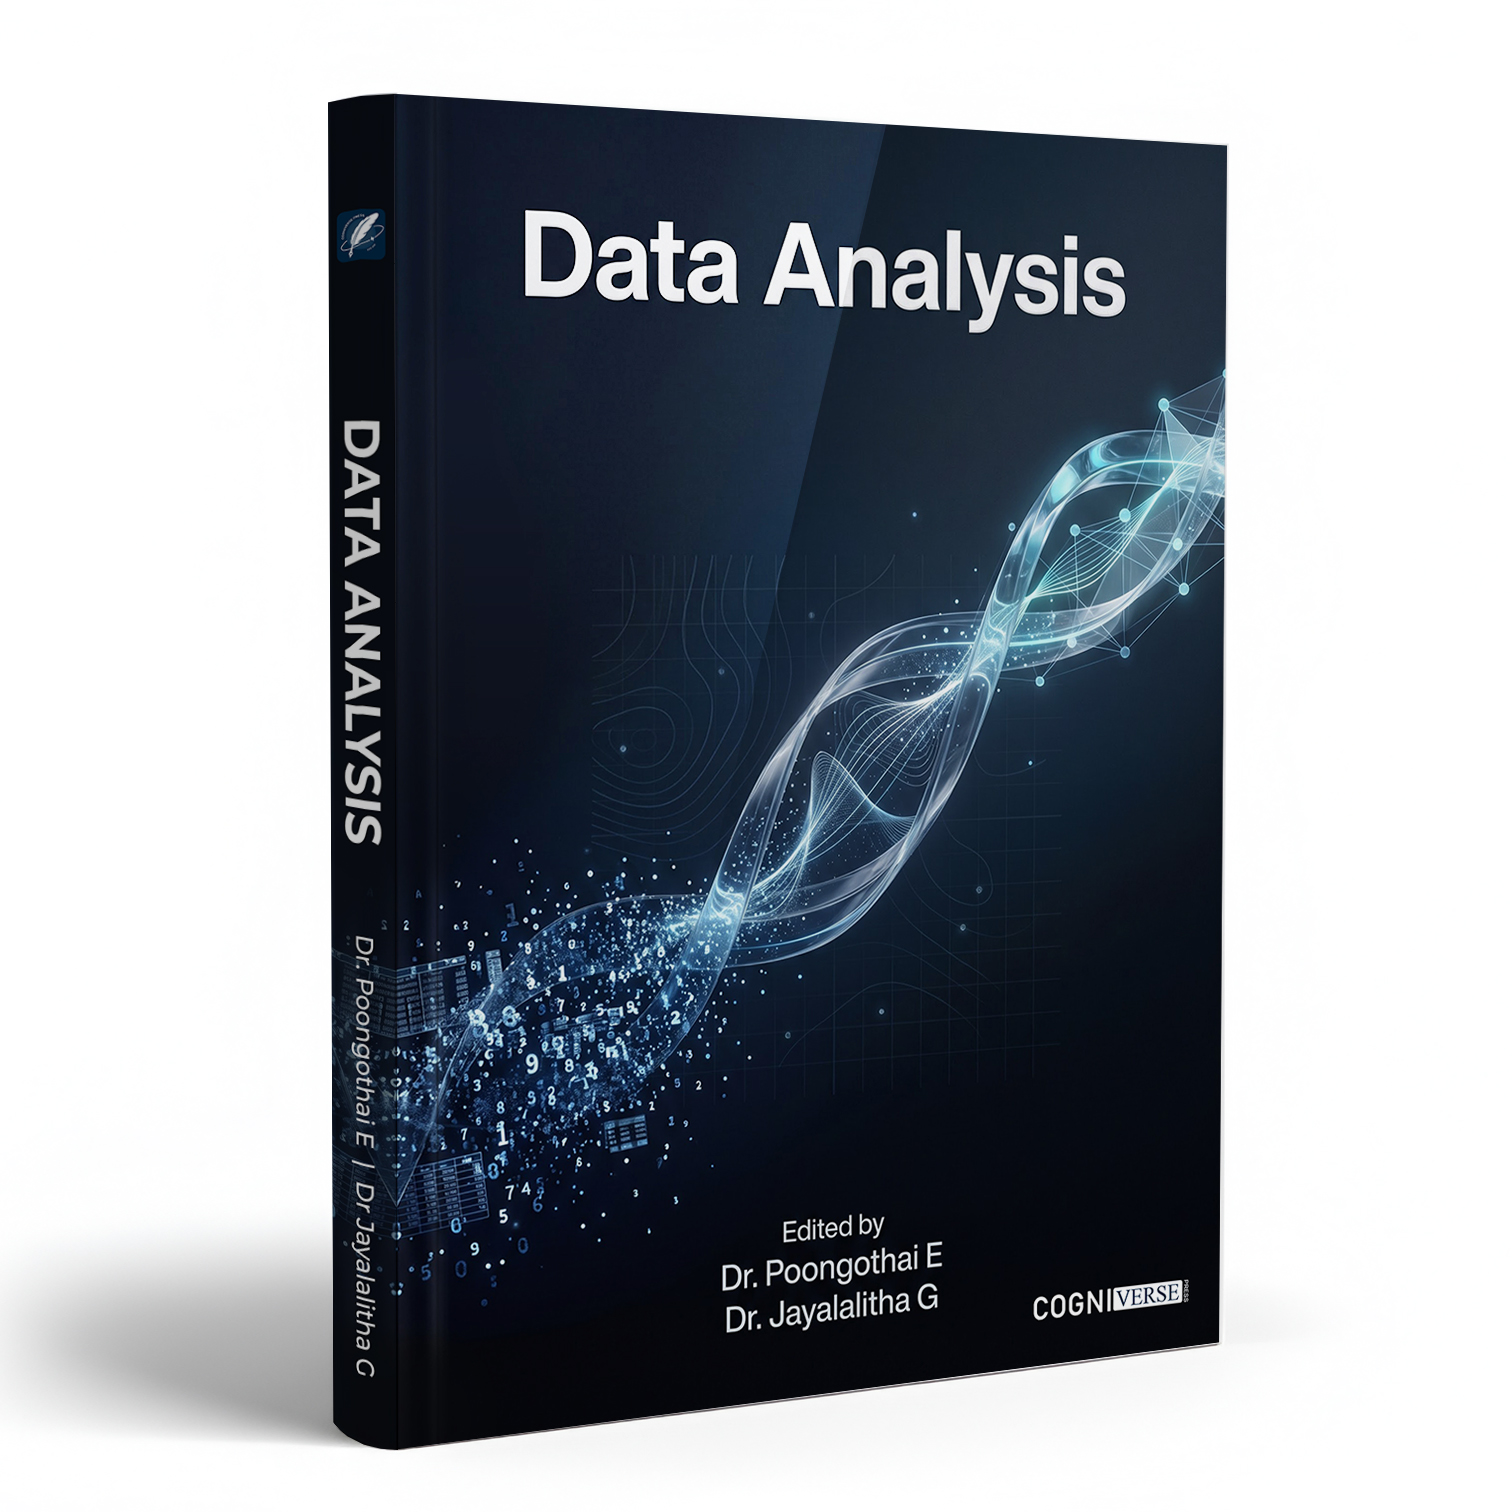
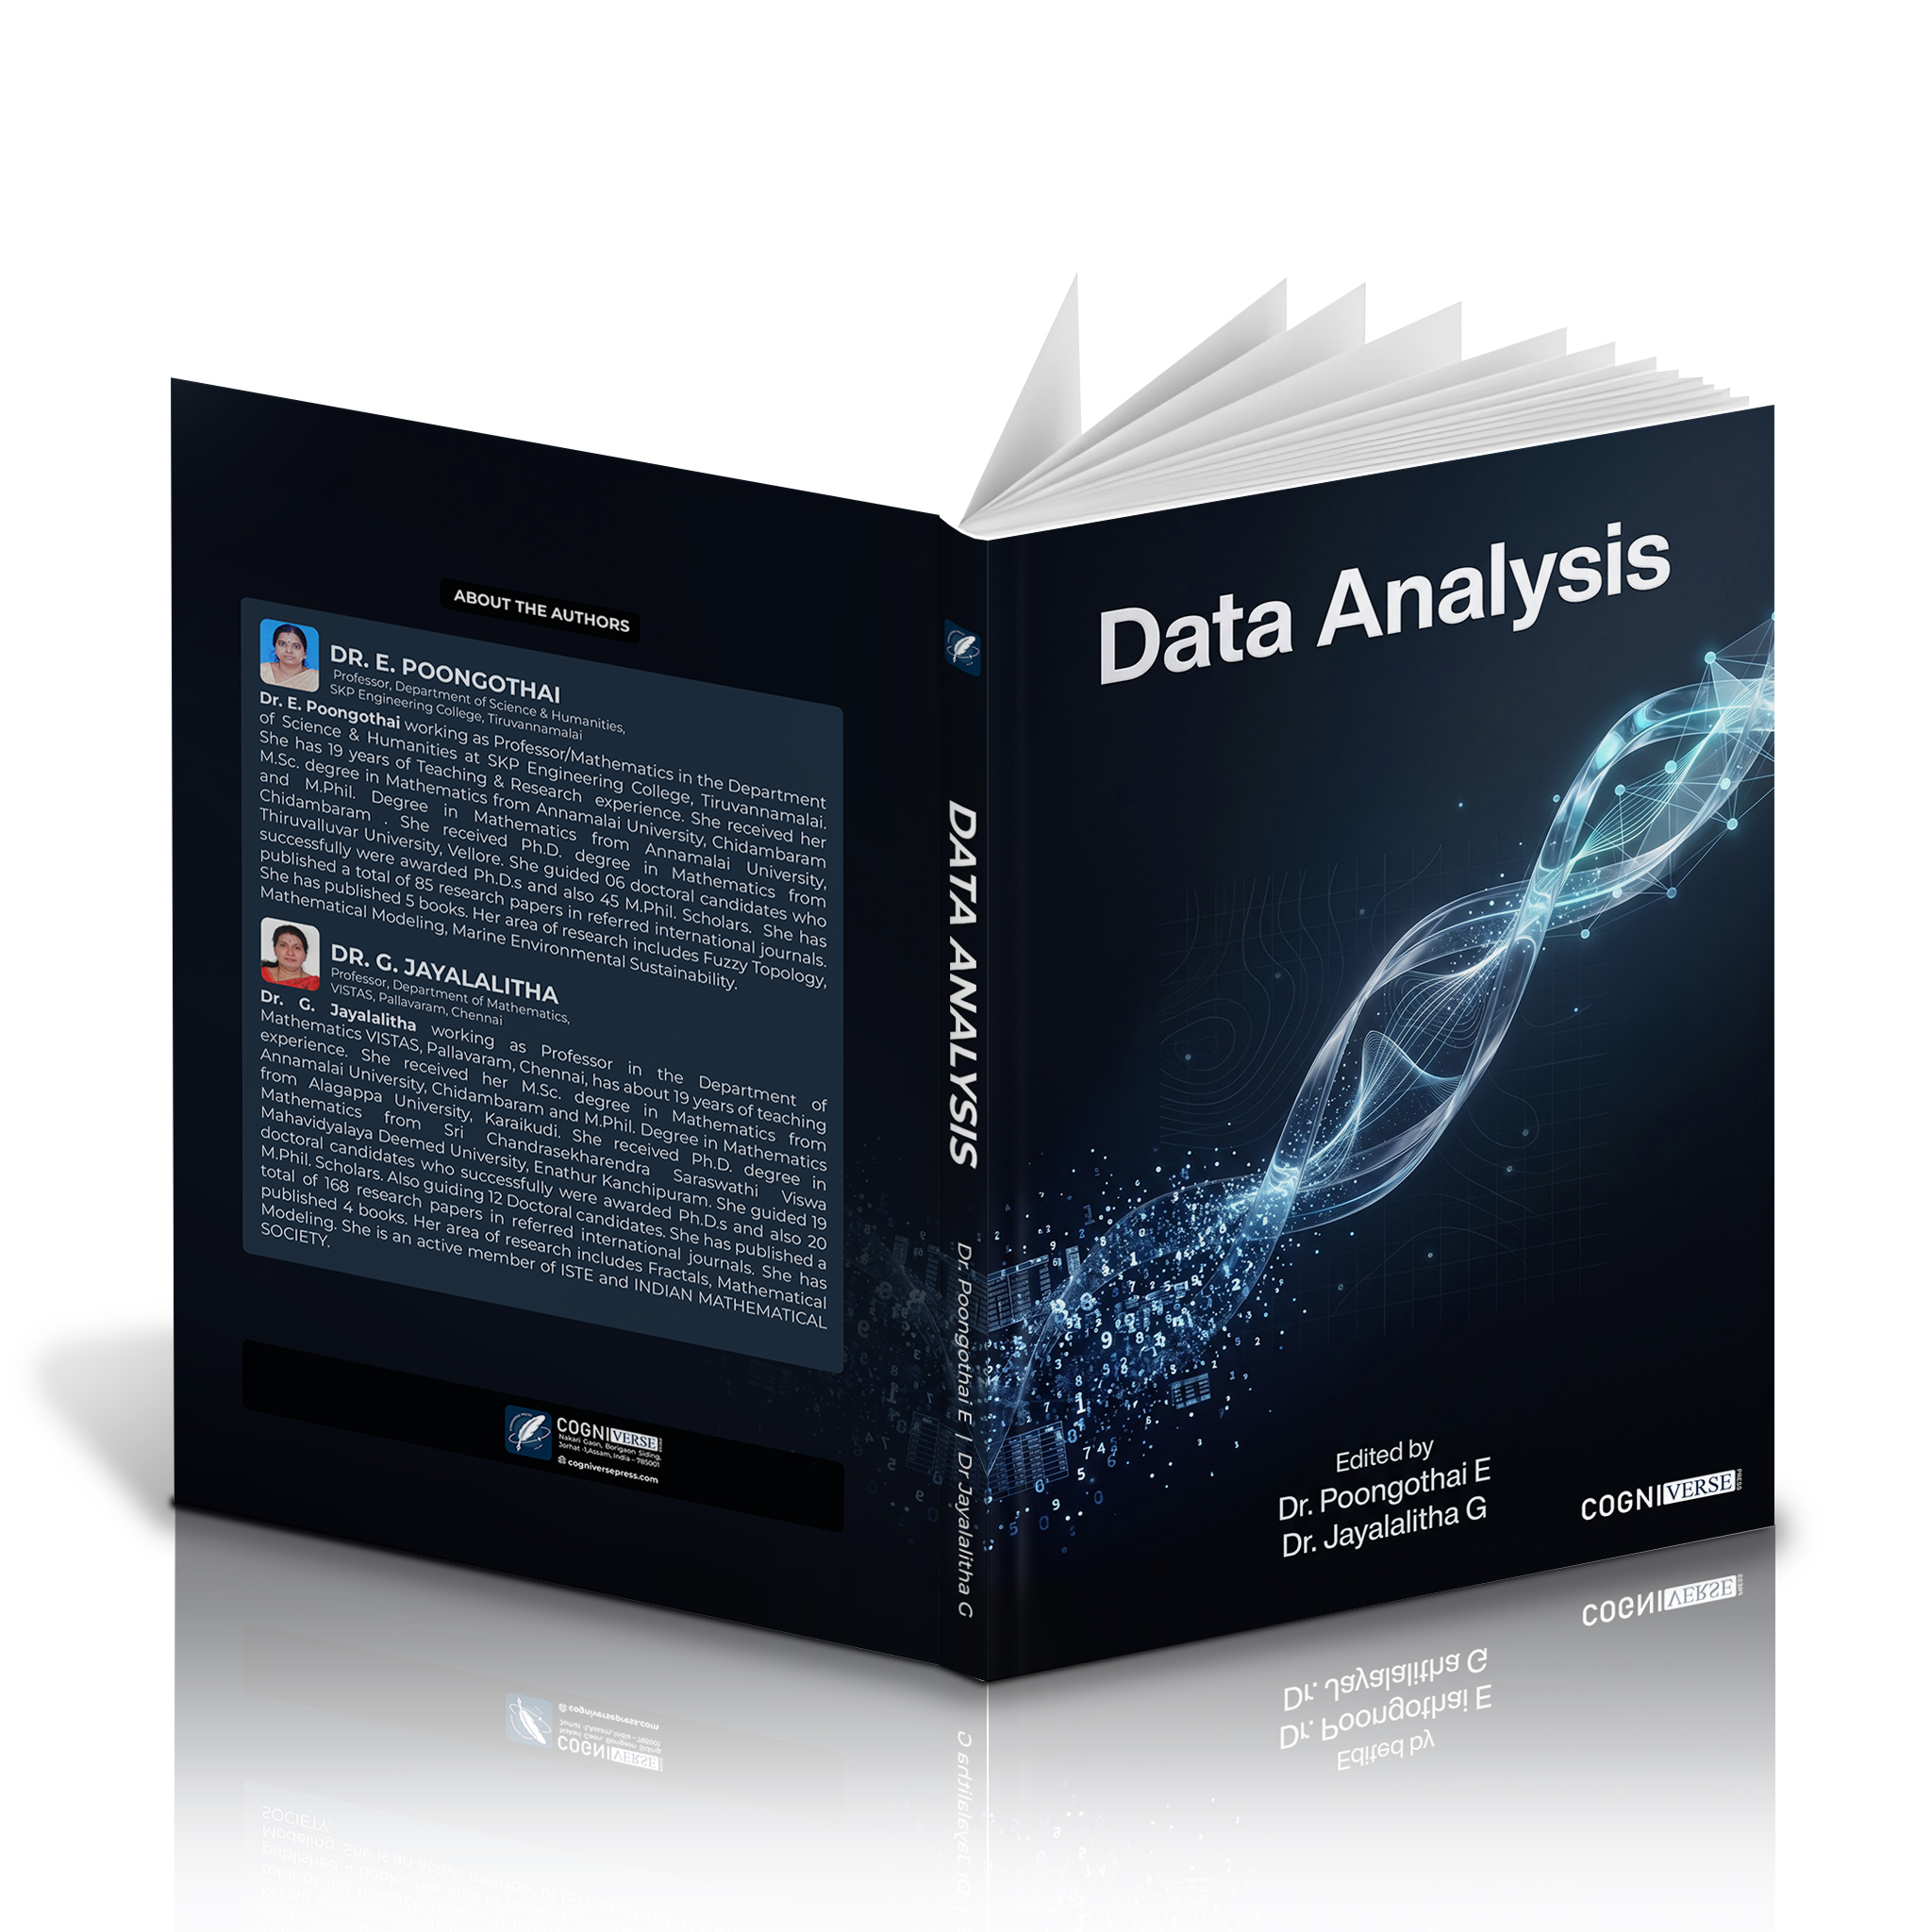
Title: Data Analysis
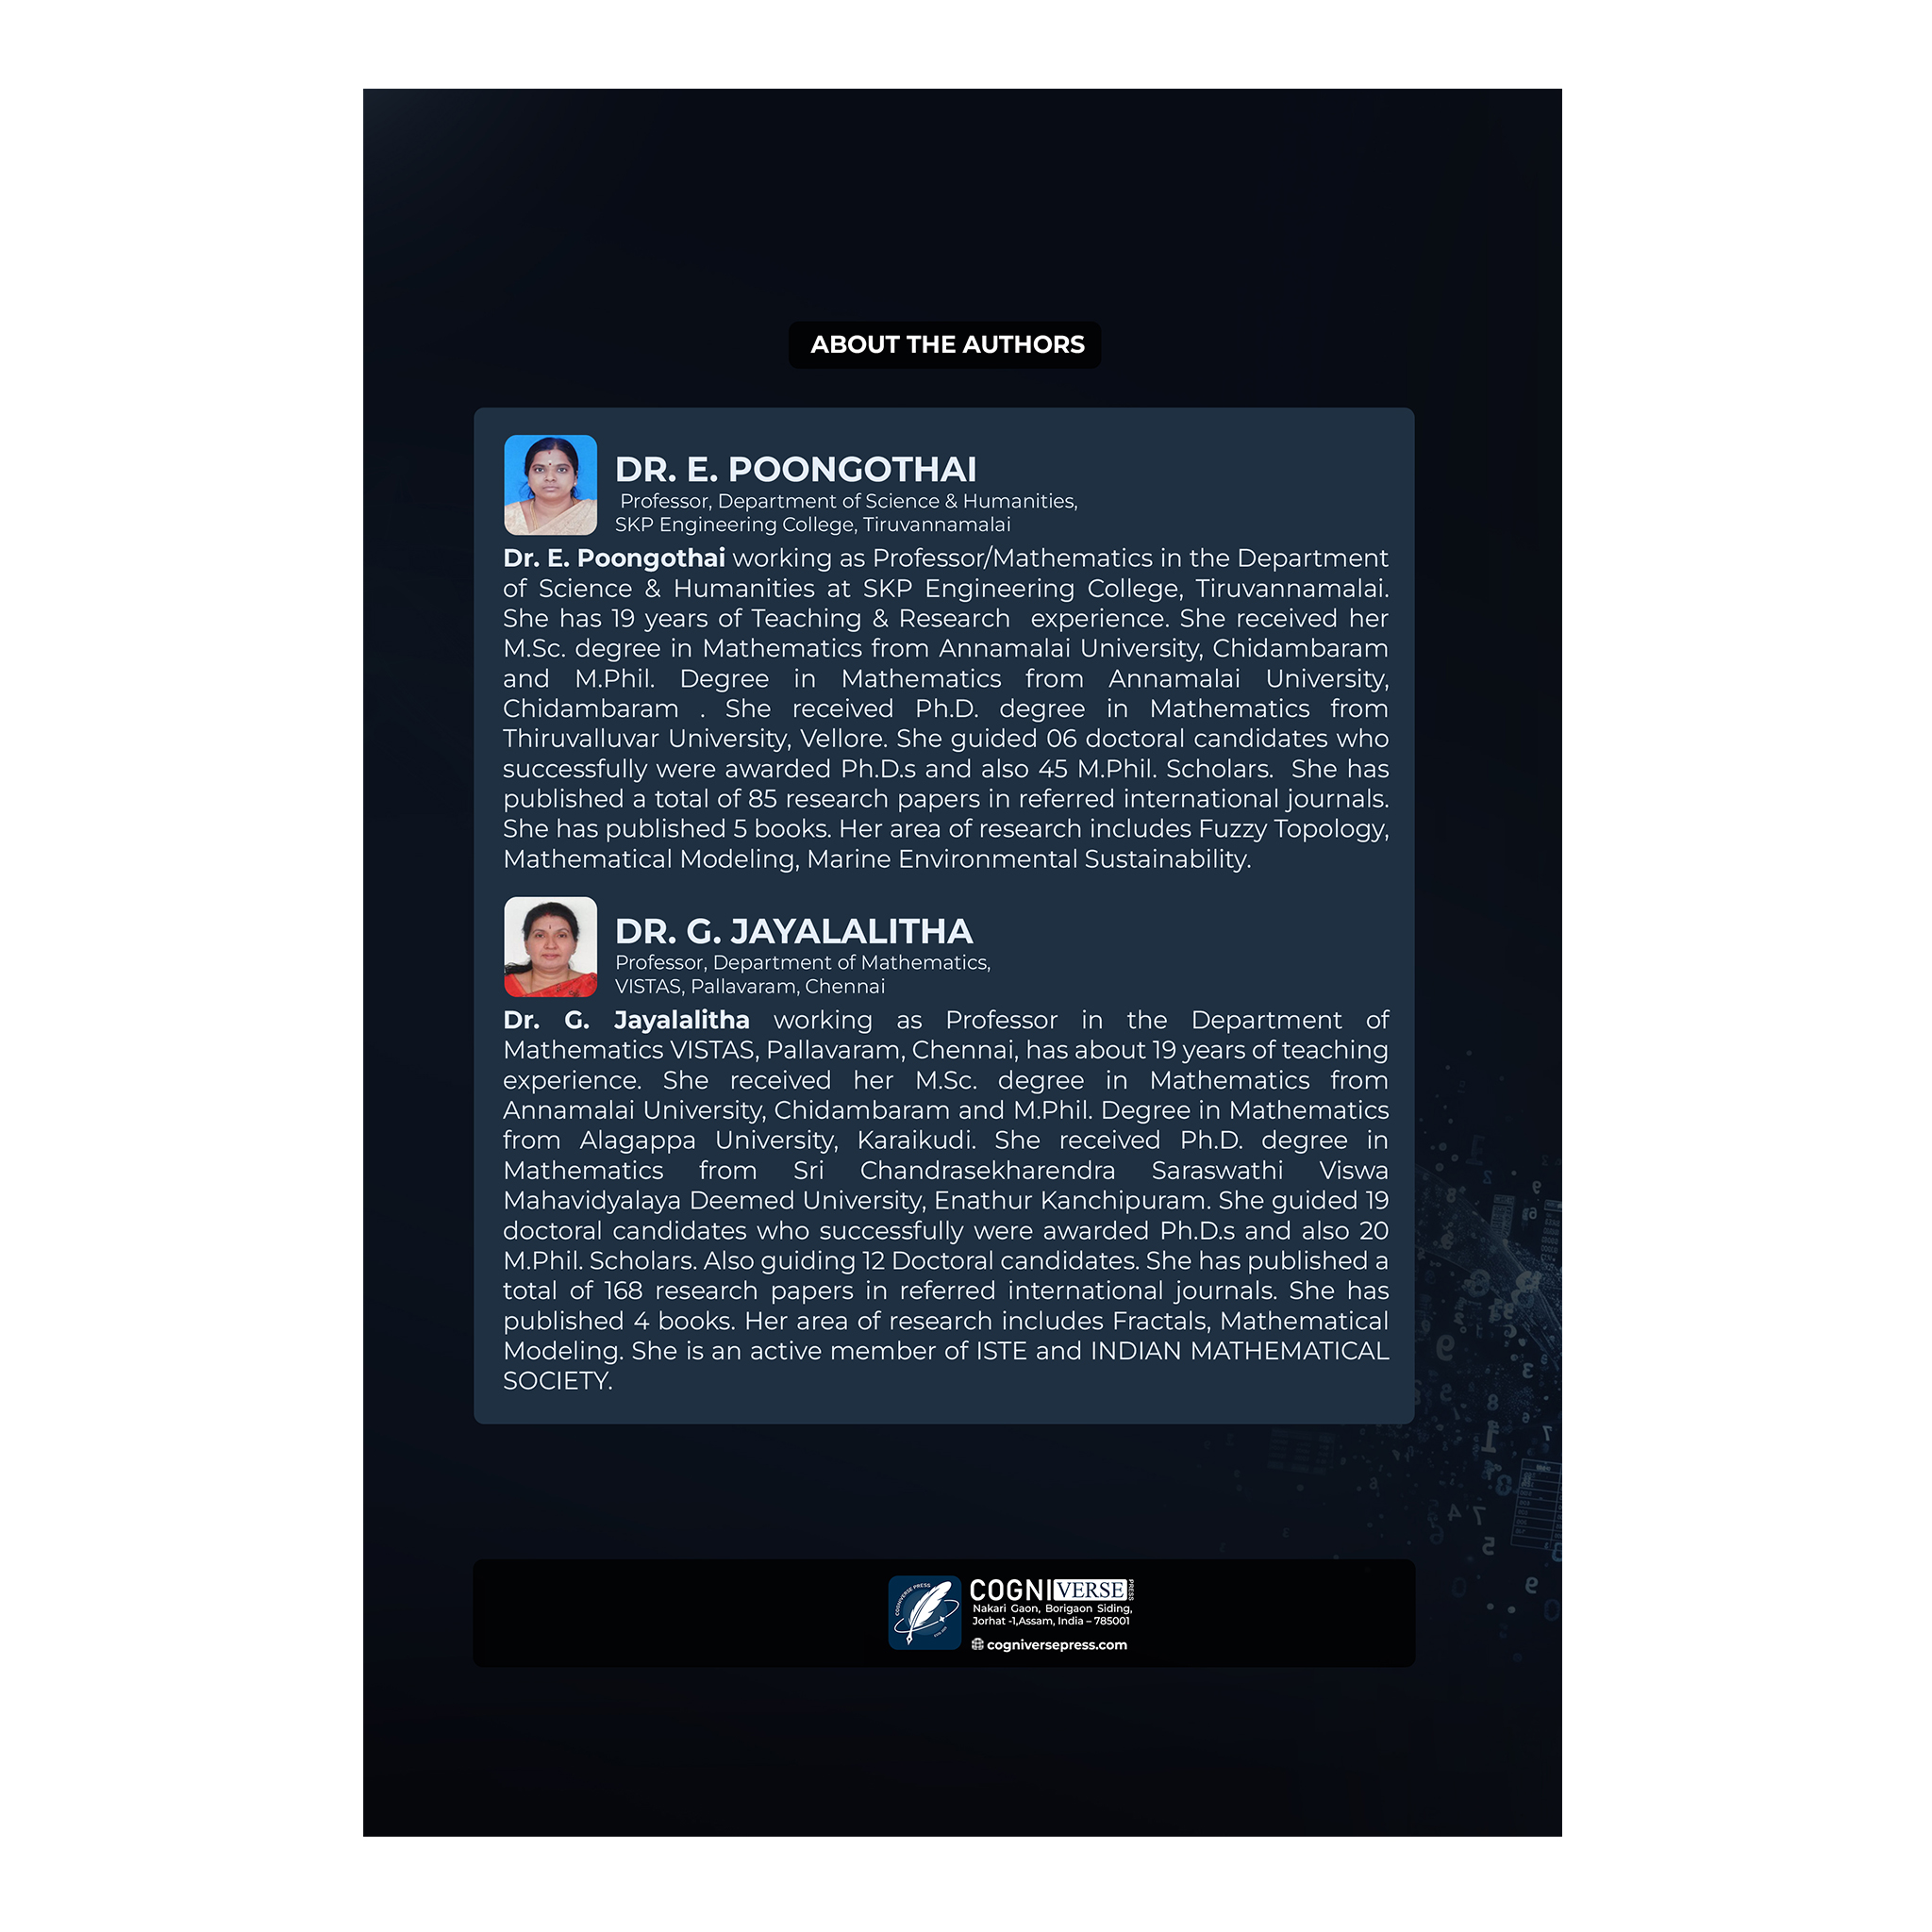
Editor(s): Dr. Poongothai E, Dr. Jayalalitha G
Publisher: Cogniverse Press
ISBN: 978-93-47652-50-9
e-ISBN: 978-93-47652-56-1
DOI: https://doi.org/10.5281/zenodo.21726947
Edition: First Edition
Publication Date: August, 2026
About the Book
Data Analysis is an academic publication authored by Dr. Poongothai E and Dr. Jayalalitha G and published by Cogniverse Press. The book offers a comprehensive introduction to fundamental statistical and mathematical tools required for analyzing complex data. Covering key areas such as probability theory, measures of central tendency and dispersion, correlation and regression, modern data analytics techniques, and time series modeling, this volume serves as a core foundational text for students, researchers, and practitioners in mathematical sciences and data analytics.
Objectives
- Understanding Random Experiments: Define and comprehend the concept of random experiments, which are processes with uncertain outcomes.
- Defining Outcomes and Trials: Explain what outcomes and trials are in the context of random experiments. Outcomes are the possible results of a random experiment, and trials are the repeated executions of the experiment.
- Definition of Probability: Define probability as a numerical measure of the likelihood of an event occurring, introduced as a ratio of favourable outcomes to total outcomes.
- Addition Theorem of Probability: Explain the addition theorem of probability, which deals with the probability of the union of two or more events.
- Bayes’ Theorem: Introduce Bayes’ theorem, which provides a formula for calculating conditional probability, particularly useful in cases where the order of events matters.
Table of Contents
Unit 1: Probability
- 1.0 Objectives
- 1.1 Introduction
- 1.2 Random Experiment
- 1.3 Outcome
- 1.4 Trial and Event
- 1.5 Exhaustive Events & Favourable Events
- 1.6 Independent Events
- 1.7 Sample Space
- 1.8 Definition of Probability
- 1.9 Addition Theorem of Probability
- 1.10 Conditional Probability
- 1.11 Mutually and Pair Wise Independent Events
- 1.12 Multiplication Theorem of Probability for Independent Events
- 1.13 Baye’s Theorem
- 1.14 Let Us Sum Up
- 1.15 Key Words
- 1.16 Some Useful Books
- 1.17 Answer to Check Your Progress
- 1.18 Terminal Questions
Unit 2: Measures of Averages and Dispersions
- 2.0 Objectives
- 2.1 Introduction
- 2.2 Types of Data
- 2.3 Diagrammatic Representation of Data
Subsections
- 2.3.1 Line Graph
- 2.3.2 Histogram
- 2.3.3 Frequency Curve
- 2.3.4 Ogive Curve
- 2.4 Measures of Central Tendency and Dispersion
Subsections
- 2.4.1 Measures of Central Tendency
- 2.4.2 Mean
- 2.4.3 Median
- 2.4.4 Mode
- 2.4.5 Applications of Central Tendency
- 2.4.6 Range
- 2.4.7 Interquartile Range
- 2.4.8 Standard Deviation
- 2.4.9 Mean Deviation
- 2.4.10 Coefficient of Variation
- 2.5 Use of Statistical Packages Such as SPSS
- 2.6 Let Us Sum Up
- 2.7 Key Words
- 2.8 Some Useful Books
- 2.9 Answer to Check Your Progress
- 2.10 Terminal Questions
Unit 3: Correlation and Regression Analysis
- 3.0 Objectives
- 3.1 Introduction
- 3.2 Karl Pearson’s Coefficient of Correlation
- 3.3 Rank Correlation
- 3.4 Repeated Ranks
- 3.5 Spearsman’ Rank Correlation
- 3.6 Regression Analysis
- 3.7 Regression Coefficient
- 3.8 Regression Equations Y on X and X on Y
- 3.9 Let Us Sum Up
- 3.10 Key Words
- 3.11 Some Useful Books
- 3.12 Answer to Check Your Progress
- 3.13 Terminal Questions
Unit 4: Data Analytics
- 4.0 Objectives
- 4.1 Introduction
- 4.2 Preliminary Steps of Data Analytics
- 4.3 Building a Predictive Model
- 4.4 Data Exploration
- 4.5 Data Visualization
- 4.6 Dimension Reduction
- 4.7 Converting a Categorial Variable to a Numerical Variable
- 4.8 Predictive Analytics
- 4.9 Types of Data Mining Problems
- 4.10 The Process of Data Mining
- 4.11 Statistical Evaluation of Big Data
- 4.12 Data Reduction
- 4.13 Neural Networks
- 4.14 Let Us Sum Up
- 4.15 Key Words
- 4.16 Some Useful Books
- 4.17 Answer to Check Your Progress
- 4.18 Terminal Questions
Unit 5: Time Series Analysis
- 5.0 Objectives
- 5.1 Introduction
- 5.2 Components of Time Series
- 5.3 Trend Analysis by Using Semi Averages Method
- 5.4 Moving Averages Method
- 5.5 Method of Straight Line
- 5.6 Autoregressive-Moving Average Models (ARMA)
- 5.7 Let Us Sum Up
- 5.8 Key Words
- 5.9 Some Useful Books
- 5.10 Answer to Check Your Progress
- 5.11 Terminal Questions



Reviews
There are no reviews yet.